What Is a Good ROAS? Benchmarks by Platform and Industry
By Ajay Kumar, SEO strategist and content writer. Last updated: October 6, 2026
A good ROAS is one that clears your break-even ROAS: 1 ÷ your margin before ad spend. If you keep 40% of each sale before paying for ads, you break even at 2.5x. Above that, your ads contribute toward profit before overhead. Below it, they don’t cover the costs included in your margin. You can find yours in seconds with the ROAS calculator.
Benchmarks are still useful as a sanity check. In the latest published data, median ecommerce ROAS runs from 1.51x on TikTok to 3.27x on Google Ads, with Meta at 1.88x and Amazon at 3.08x. This guide shows you how to work out your own number first, then how it compares with each platform and with 18 industries.
What is a good ROAS?
The short version:
- ROAS = ad revenue ÷ ad spend. Spend $1,000 and earn $4,000, and your ROAS is 4x.
- Break-even ROAS = 1 ÷ margin before ad spend. A 25% margin means 4x. A 50% margin means 2x.
- Platform medians (August 2025 to July 2026): Google Ads 3.27x, Amazon 3.08x, Meta 1.88x and TikTok 1.51x.
- Your margin matters more than any benchmark. The same 3x can be profitable for one store and a loss for another.
What is ROAS, and how do you calculate it?
ROAS stands for return on ad spend. It tells you how much revenue your ads bring in for each dollar you spend on them. (Not to be confused with ROA, return on assets, which is a different, finance-based ratio.)
ROAS = ad revenue ÷ ad spend
If you spend $1,000 on ads and they bring in $4,000 in sales, your ROAS is $4,000 ÷ $1,000 = 4x. You’ll also see that written as 4:1 or 400%. They all mean the same thing.
Amazon sellers often use ACoS instead. It’s the same relationship flipped: ACoS = ad spend ÷ ad sales, so ROAS = 1 ÷ ACoS.
| ROAS | As a percentage | Matching ACoS |
| 1.5x | 150% | 66.7% |
| 2x | 200% | 50% |
| 3x | 300% | 33.3% |
| 4x | 400% | 25% |
| 5x | 500% | 20% |
| 10x | 1,000% | 10% |
How to find your own good ROAS?
ROAS counts revenue, not profit. A 4x ROAS can still lose money if your costs eat most of each sale. So start with your margin.
- Add up the costs of one sale before ads: product cost, shipping or fulfillment, payment fees and any returns you expect. Payment fees add up quickly, so check what you actually pay with the Stripe fee calculator or the PayPal fee calculator.
- Work out your margin before ad spend: (price − those costs) ÷ price.
- Divide 1 by that margin. The result is your break-even ROAS.
| Margin before ad spend | Break-even ROAS |
| 20% | 5.00x |
| 25% | 4.00x |
| 30% | 3.33x |
| 40% | 2.50x |
| 50% | 2.00x |
| 60% | 1.67x |
| 70% | 1.43x |
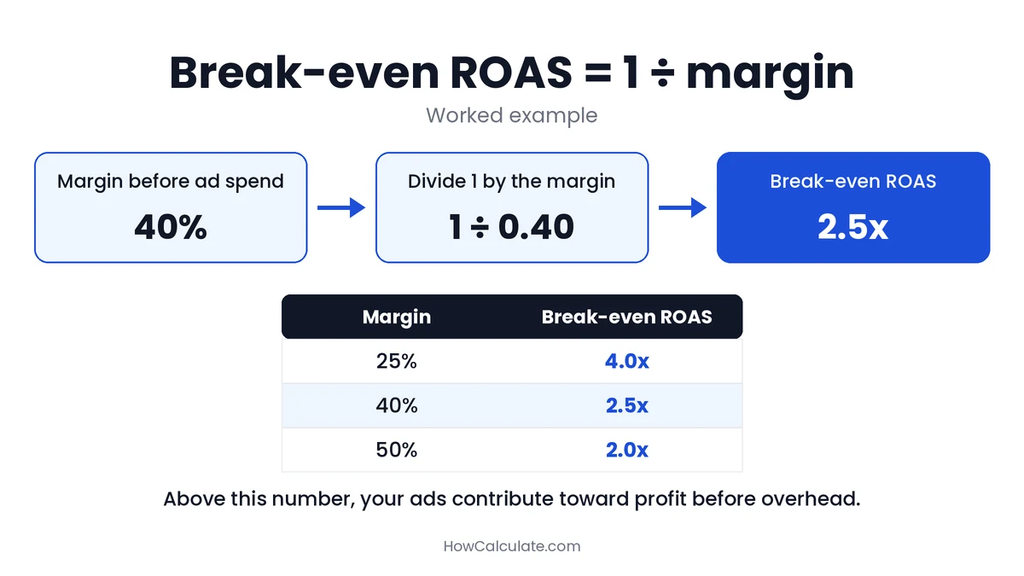
You don’t need to do this by hand. The break-even mode in the ROAS calculator takes your margin and returns your break-even ROAS and ACoS.
A worked example
You sell a product for $100. The product costs $40, shipping and fulfillment cost $10, and payment fees and other costs are $5. That leaves $45, so your margin before ads is 45% and your break-even ROAS is 1 ÷ 0.45 = 2.22x.
Say you spend $25 on ads to make that $100 sale. Your ROAS is 4x, well above break-even, and you keep $20 (100 − 55 − 25).
Add a profit goal
Break-even only means your ads covered the costs in your margin. To aim for a profit, use target ROAS = 1 ÷ (margin − the profit you want), with both as a share of revenue. With a 45% margin and a 15% profit goal, that’s 1 ÷ 0.30 = 3.33x.
Is 2x, 3x, 4x or 5x a good ROAS?
It depends entirely on your margin. This table shows the profit you keep from every $100 of revenue after ad spend, before other overhead:
| ROAS | 25% margin | 40% margin | 60% margin |
| 2x | −$25.00 | −$10.00 | +$10.00 |
| 3x | −$8.33 | +$6.67 | +$26.67 |
| 4x | $0.00 | +$15.00 | +$35.00 |
| 5x | +$5.00 | +$20.00 | +$40.00 |
A 4x ROAS is exactly break-even at a 25% margin and a good result at 60%. That’s why “4x is good” is only a rule of thumb. A useful ROAS target comes from your own margins and business economics.
ROAS benchmarks by platform
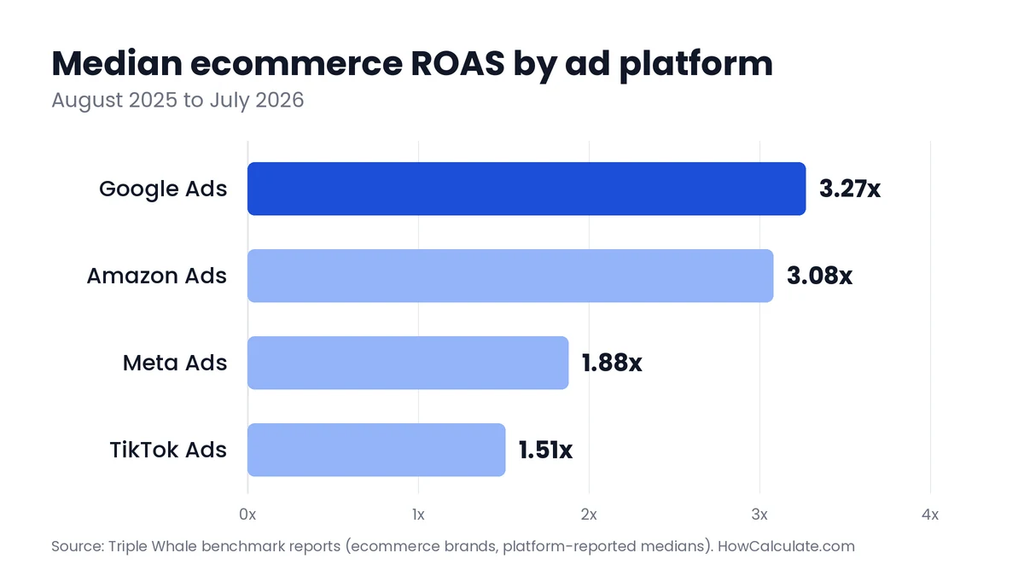
Triple Whale publishes medians from the brands that use its platform, and the figures below cover August 2025 to July 2026. The last column is my own calculation: the margin you need to break even at that median.
| Platform | Median ROAS | A year earlier | Brands in the data | Industries in the report | Margin needed to break even at the median |
| Google Ads | 3.27x | 3.39x | 21,000+ | 15 | 30.6% |
| Amazon Ads | 3.08x | 2.81x | 2,800+ | 9 | 32.5% |
| Meta Ads | 1.88x | 1.86x | 40,000+ | 17 | 53.2% |
| TikTok Ads | 1.51x | 1.43x | 5,900+ | 10 | 66.2% |
What each platform’s data shows?
- Google Ads (3.27x). ROAS slipped from 3.39 while average order value rose to $87.65, and ROAS fell in 11 of the 15 industries.
- Amazon Ads (3.08x). ROAS rose 9.70% from 2.81, and every industry in the data delivered at least 2.46. Triple Whale notes that Amazon shoppers tend to arrive with purchase intent already formed. Amazon’s fees come out of your margin, so check your break-even before celebrating.
- Meta Ads (1.88x). ROAS edged up from 1.86, and twelve of 17 industries improved. Meta mostly reaches people who weren’t searching, so a lower median is normal, and brands there often need a healthier margin or repeat customers to profit.
- TikTok Ads (1.51x). ROAS varied more by industry than on any other platform in these reports, and four of the ten industries came in below 1x. Triple Whale also notes that last-click attribution may undercount sales that happen later.
ROAS benchmarks by industry
This table gathers the median ROAS for every industry in the four reports for the same period. A dash means that the industry isn’t in that platform’s report.
| Industry | Google Ads | Meta | Amazon | TikTok |
| Apparel & Accessories | 3.99x | 2.24x | 3.46x | 2.70x |
| Automotive | 4.07x | – | – | – |
| Baby | 3.71x | 2.25x | – | – |
| Beauty | 2.81x | 1.54x | 2.72x | 0.46x |
| Books & Music | 2.79x | 1.65x | – | – |
| Business Supplies & Equipment | 3.15x | 2.34x | – | – |
| E-learning & Online Courses | – | 1.19x | – | – |
| Electronics | 2.91x | 1.94x | 3.93x | 1.98x |
| Food & Beverage | 3.18x | 1.61x | 2.73x | 0.33x |
| Health & Wellness | 2.06x | 1.44x | 2.46x | 0.42x |
| Home & Garden | 3.48x | 2.25x | 3.54x | 2.02x |
| Lifestyle & Boutique | 3.10x | 2.04x | – | 2.00x |
| Media & Publishing | – | 1.13x | – | – |
| Medical Devices & Equipment | – | 1.63x | – | – |
| Pets & Animals | 2.88x | 1.60x | 2.74x | 0.02x* |
| Sports & Outdoors | 4.35x | 2.35x | 3.56x | 1.44x |
| Toys, Art & Collectibles | 3.22x | 1.95x | 3.44x | 1.57x |
| Travel Accessories (and Luggage) | 4.07x | 2.28x | – | – |
Note: TikTok’s Pets & Animals row shows a $0.38 average order value in the same report, which looks like a data quirk or a very small sample. I wouldn’t read anything into it.
How to use this table
- Compare like with like. Look at your industry on the platform you actually use.
- Check it against your margin. To find the margin you need at a median, divide 1 by the ROAS. Health & Wellness on Google Ads (2.06x) needs a margin of about 49% to break even. On Meta (1.44x), it needs about 69%. Sports & Outdoors on Google (4.35x) needs only about 23%.
- Amazon is the tightest group. Its industries run from 2.46x to 3.93x, so Electronics needs only about a 25% margin at the median, and Health & Wellness about 41%.
- A ROAS below 1x means the ads cost more than the sales they were credited with. Even a 100% margin wouldn’t cover it, so a business there is counting on repeat purchases or on sales the platform doesn’t track.
What if your ROAS is below break-even?
Don’t just cut the budget. Find where the leak is. Your ROAS is the result of a chain of numbers:
- Reach cost. A high CPM means each impression is expensive.
- Attention. A low click-through rate means your ad isn’t earning clicks. Check yours with the CTR calculator.
- Conversion. A low conversion rate means the page or offer isn’t closing sales. Measure what each sale costs with the CPA calculator.
- Order value. A low average order value means each sale brings in too little revenue.
Fix the weakest link first. You can also raise your margin by negotiating costs or adjusting your prices, which lowers the ROAS you need. If customers buy more than once, compare your first-order results with your customer acquisition cost, because repeat purchases can justify a lower first-order ROAS.
Why you’ll see different numbers elsewhere?
If you’ve searched this topic, you’ve seen figures that don’t match. The usual reasons:
- Different time periods. Even Triple Whale’s own reports differ from year to year. The year-earlier window had Google at 3.39x, Meta at 1.86x, Amazon at 2.81x and TikTok at 1.43x.
- Different providers and samples. Each company measures different brands.
- Median versus average. A few big winners pull an average up, so medians usually show the typical brand better.
- Platform ROAS versus blended ROAS. A platform counts the sales it takes credit for. Add up several platforms and the same sale can be counted twice.
None of these is “wrong.” They measure slightly different things, which is another reason to anchor on your own break-even.
What about US-only data?
I couldn’t find a large US-only ROAS study. Triple Whale’s reports don’t break results down by country, and its benchmarks dashboard help page says the benchmarks include all markets, not just the US, converted into US dollars. I’d rather say that than pass a global number off as a US average.
The best US-specific data I found comes from WordStream’s 2026 search advertising report, which covers 13,474 US-based campaigns from April 2025 to March 2026. It reports four metrics: a 6.64% click-through rate, a $5.42 cost per click, an 8.18% conversion rate and a $66.69 cost per lead. It doesn’t include ROAS, but if you run lead generation, those figures are a useful reference for your own click-through and cost-per-lead numbers.
Why isn’t a higher ROAS always better?
Chasing the highest ROAS can cap your growth. Compare two campaigns:
| Campaign A | Campaign B | |
| Ad spend | $10,000 | $50,000 |
| Revenue | $50,000 | $175,000 |
| ROAS | 5.0x | 3.5x |
| Profit at a 40% margin | $10,000 | $20,000 |
| Profit at a 25% margin | $2,500 | −$6,250 |
At a 40% margin, the lower-ROAS campaign earns twice the profit, because it sells much more. At a 25% margin, the same campaign loses money. So the right ROAS depends on your margin, and on whether you’re optimizing for efficiency or for growth.
How to raise your ROAS?
For ecommerce purchase campaigns, ROAS can be calculated as average order value ÷ CPA, when CPA means ad cost per order. With an $80 average order value and a $25 cost per order, your ROAS is 3.2x. So you have two levers:
- Raise your order value with bundles, upsells and free-shipping thresholds.
- Lower your cost per order by improving your landing page, tightening your audience and cutting wasted spend. The CPA calculator also shows your break-even CPA from your order value and margin.
You can also improve what comes before the sale: a better click-through rate means cheaper clicks, and a lower CPM means cheaper reach. The full set of marketing calculators covers every step of that chain.
Frequently asked questions
Is a 2x ROAS good?
It’s exactly break-even at a 50% margin. Above that margin it makes money before overhead, and below it you lose.
Is a 3x ROAS good?
It’s above break-even if your margin before ad spend is above 33.3%.
Is a 4x ROAS good?
It’s above break-even at a margin above 25%. That’s a decent result, but not automatically a great one.
Is a 5x ROAS good?
It’s above break-even at a margin above 20%. It’s strong, but a lower-ROAS campaign can still earn more total profit at scale.
What is a good ROAS for ecommerce?
Platform medians range from about 1.5x to 3.3x, and your break-even ROAS (1 ÷ margin) is the number that counts. Work it out in the ROAS calculator.
What is a good ROAS for Google Ads?
The latest ecommerce median is 3.27x, from 2.06x in Health & Wellness to 4.35x in Sports & Outdoors.
What is a good ROAS for Meta ads?
The median is 1.88x, from 1.13x in Media & Publishing to 2.35x in Sports & Outdoors. Compare yourself with similar brands.
What is a good ROAS on Amazon?
The median is 3.08x, and every industry in the data was at least 2.46x. Amazon fees reduce your margin, so work out your own break-even.
What is a good ROAS on TikTok?
The median is 1.51x, but it varies widely by category, from 2.70x in Apparel & Accessories to 0.33x in Food & Beverage (leaving aside the Pets & Animals quirk).
What ROAS do I need to break even?
Divide 1 by your margin before ad spend. A 40% margin means 2.5x.
What is the difference between ROAS and ACoS?
There are two views of the same thing. ROAS = 1 ÷ ACoS, so a 4x ROAS equals a 25% ACoS.
Calculate your ROAS
Put your own numbers into the HowCalculate ROAS calculator to see your ROAS, your ACoS and your break-even ROAS, then compare them with the benchmarks above. Looking for payment costs too? See all the fee calculators.
How I sourced and checked these numbers?
All platform and industry figures come from Triple Whale’s published reports for Google Ads, Meta, Amazon and TikTok, covering August 1, 2025 to July 31, 2026. I read each report myself. The “margin needed” figures, profit tables, and examples are my own calculations, which I rechecked.
Benchmarks are reference points, not targets or guarantees. These are platform-reported ecommerce medians, so they won’t match every business, and nothing here is financial advice. Last checked October 2026.